The practice of setting a required minimum wage is present in most nations across the globe. Minimum wage is important to ensure that workers are compensated fairly for their labor and can meet their basic living needs. It can help reduce poverty and income inequality, promote decent working environments, and increase the standard of living for workers. Some nations will use a minimum wage to ensure that their lowest paid workers are guaranteed a base earnings level that would not otherwise occur, while, in other countries, unions, market forces, or other factors are more important in keeping up the wages of the lowest-paid workers.
Since the minimum wage acts as a wage floor, the pay below which wages cannot fall, it is less in value than the median wage, the middle point of wages that workers earn nationally. This is an important aspect to consider for setting wages internationally. In some countries, the median wage is at, or just above, the minimum wage; whereas, in other countries, the median wage is far higher than the minimum wage, which serves as an absolute wage floor that few workers are actually paid. There can be exceptions to the minimum wage, and it can even be limited to certain regions within a state or country, such as counties and cities having specific minimum wage rates.
The difference between the minimum wage and the median wage can be expressed as a ratio, which varies by country. Upon closer inspection of the minimum-to-median wage ratio between countries, we can discern interesting relationships between the ratio and other economic factors such as:
- Gross Domestic Product (GDP) per Capita
- Human Development Index (HDI)
- Gini Income Inequality Coefficient
This blog explores these relationships to provide a deeper understanding of minimum wage versus median wage on a global scale.
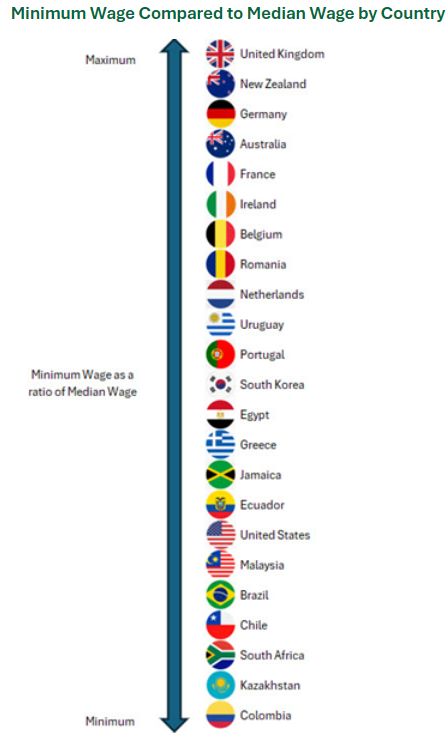
Figure 1: Displayed above is a chart of the countries selected from the Global Salary Calculator for analysis in this blog, ordered by the ratio of their minimum wage to their national median wage. This ratio allows for cross-country comparisons without having to convert to a common currency.
Gross Domestic Product (GDP) per Capita
Below is a chart of a selection of countries present in ERI’s Global Salary Calculator. The countries are plotted based on the distance of each country’s minimum wage to its median wage, compared with the gross domestic product per capita of each country. 1 The data follow a correlation coefficient of r=0.64 (when transformed for nonlinearity) †, indicating a moderate positive correlation between the ratio of minimum wage to median wage and the GDP per capita of each country.
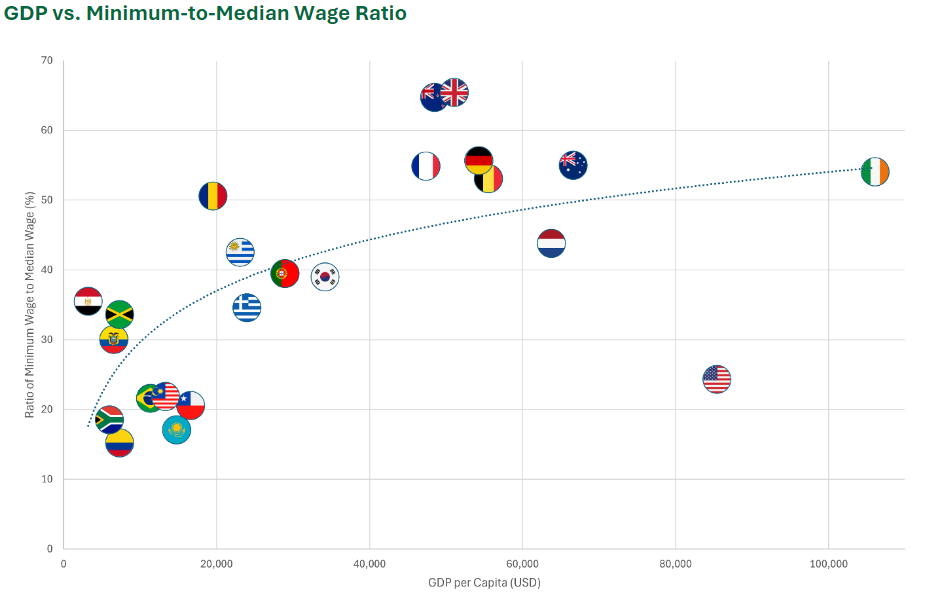
Countries on the very low end of the spectrum for GDP per capita (USD 20,000 and below) largely have lower minimum-to-median wage ratios, anywhere from 15% to 35%. This means that the minimum wages in these countries are about 15% to 35% of the overall median wage in each country. Middle-income countries in the $20,000-$40,000 range seem to coalesce around a wage ratio of 40%, while higher-income countries ($40,000 and greater) generally fall in the 50%-70% range. An exception to this latter point is the United States, which, despite its high GDP, has a wage ratio of about 25%, which is more in line with countries on the lower end of the GDP scale, such as Chile or Colombia. It is worth mentioning, however, that the wage ratio for the U.S. is based on the federal minimum wage – many states and municipalities within the U.S. have significantly higher minimum wages than the federal rate.
Notably, the marginal increase in the minimum-to-median wage ratio for each segment of GDP per capita levels off once GDP per capita reaches about $30,000. From this point, most countries in the selection have wage ratios between 40% and 60%.
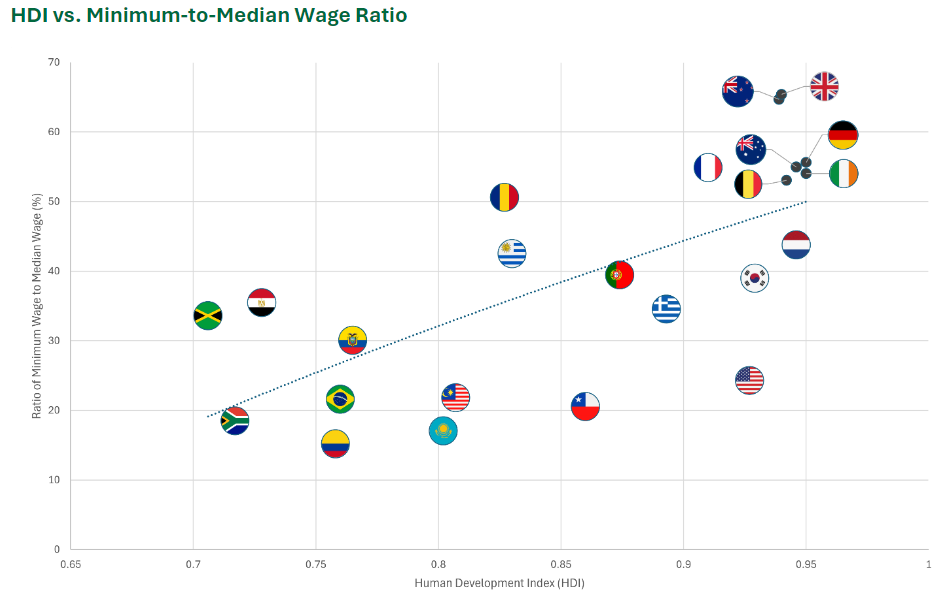
Human Development Index (HDI)
Next, we look at the minimum-to-median wage ratios as they relate to each country’s Human Development Index (HDI) score.2 The HDI attempts to measure the degree of development in a given country. Higher scores indicate that a country is more developed, whereas lower scores indicate less development.
It initially appears that the higher a country’s HDI score, the closer their minimum wage is in value to the country’s median wage. Here, we see a correlation coefficient of r =0.69, a moderate positive correlation, which is more positively correlated than the previous example that showcased the GDP per capita factor. Most countries in the selection that have HDI scores of 0.9 or greater have wage ratios that fall in the range of 50% to 70%, with some outliers that have significantly lower wage ratios. Countries with HDI scores below 0.9 appear to not follow the trend line as consistently as the more highly developed countries.
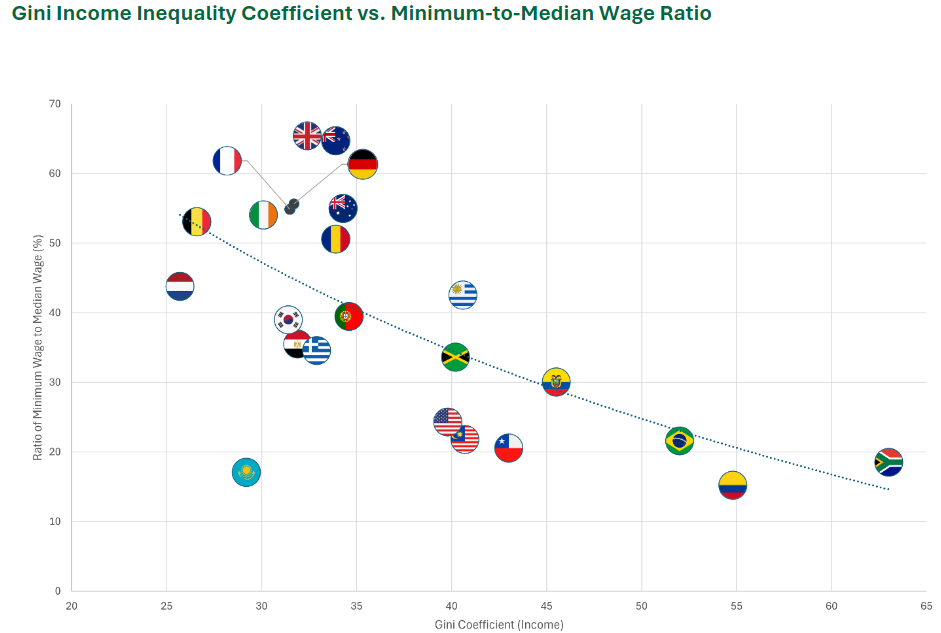
Gini Income Inequality Coefficient
Lastly, we examine the minimum-to-median wage ratio through the lens of the Gini income inequality coefficient, which measures the distribution of incomes in a population.3 A higher Gini income inequality coefficient indicates an overall higher level of income inequality, whereas lower coefficient values indicate overall lower levels of income inequality. Here, we see a correlation coefficient of r =-0.64, which implies a moderate negative correlation; the more income inequality a nation has, as measured by the Gini income inequality coefficient, the lower their minimum wage is relative to their median wage. Several countries, such as Belgium, Portugal, Jamaica, Ecuador, and Brazil, closely follow this trend line. A notable outlier is Kazakhstan, which has a Gini coefficient that would imply a minimum-to-median wage ratio close to the 50%-60% range, but instead finds itself with a much lower ratio of approximately 18%.
Final Thoughts
Essentially, countries that are wealthier, more developed, and more evenly spread in terms of income distribution nationwide tend to have a closer relation between minimum wage and national median wage. Countries that are low in wealth, less developed, and highly skewed in terms of income distribution appear to have relatively low minimum wages in comparison with the median wage. While any causation naturally cannot be inferred from the above correlations, the various factors explored in this blog may inspire ideas or questions, perhaps leading to further examination and research in this area.
How to Use ERI in Your Compensation Planning
Compensation professionals can further their global compensation planning and minimum wage research using ERI’s Assessor Platform. ERI provides not only global compensation data but also detailed minimum wage information at the federal, state/province, and local levels in the U.S. and Canada to assist with your compensation management. We provide up-to-date minimum wage data, such as the minimum salary thresholds required to qualify for exemption, local and state pay transparency rules in the U.S., and the ability to search for current and planned minimum wage rates for major cities, counties, and municipalities. With ERI’s reliable minimum wage data, you can stay on top of minimum wage changes to ensure that your organization complies with local labor laws, adheres to applicable regulations, and can strategically plan and budget for minimum wage increases.
† The correlation coefficient r represents the strength of the linear relationship between two variables. An r value of 1.0 represents a perfect positive correlation, r=-1.0 represents a perfect negative (or inverse) correlation, and r=0 represents no linear correlation whatsoever.
- World Economic Outlook Database. International Monetary Fund (IMF). https://www.imf.org/en/Publications/WEO/weo-database/2024/April
- Human Development Report 2023-2024. United Nations Development Programme. https://hdr.undp.org/content/human-development-report-2023-24
- Gini index. World Bank Group. https://data.worldbank.org/indicator/SI.POV.GINI/?skipRedirection=true&view=map